
On 4 August 2025, PageSpeed Insights gave one ecommerce homepage two different performance records in the same report.
The URL-level field panel failed Core Web Vitals. Over the latest 28-day period, LCP was 3.8 seconds, INP was 241 milliseconds and CLS was 0.03. The Lighthouse run below it scored 45, with LCP at 3.5 seconds, Total Blocking Time at 990 milliseconds and CLS at 0.001.
The field panel established that the measured desktop population for that URL had crossed the LCP and INP thresholds. Lighthouse recorded one simulated page load. It could help investigate the failure, but its score was not the failed Core Web Vitals assessment.
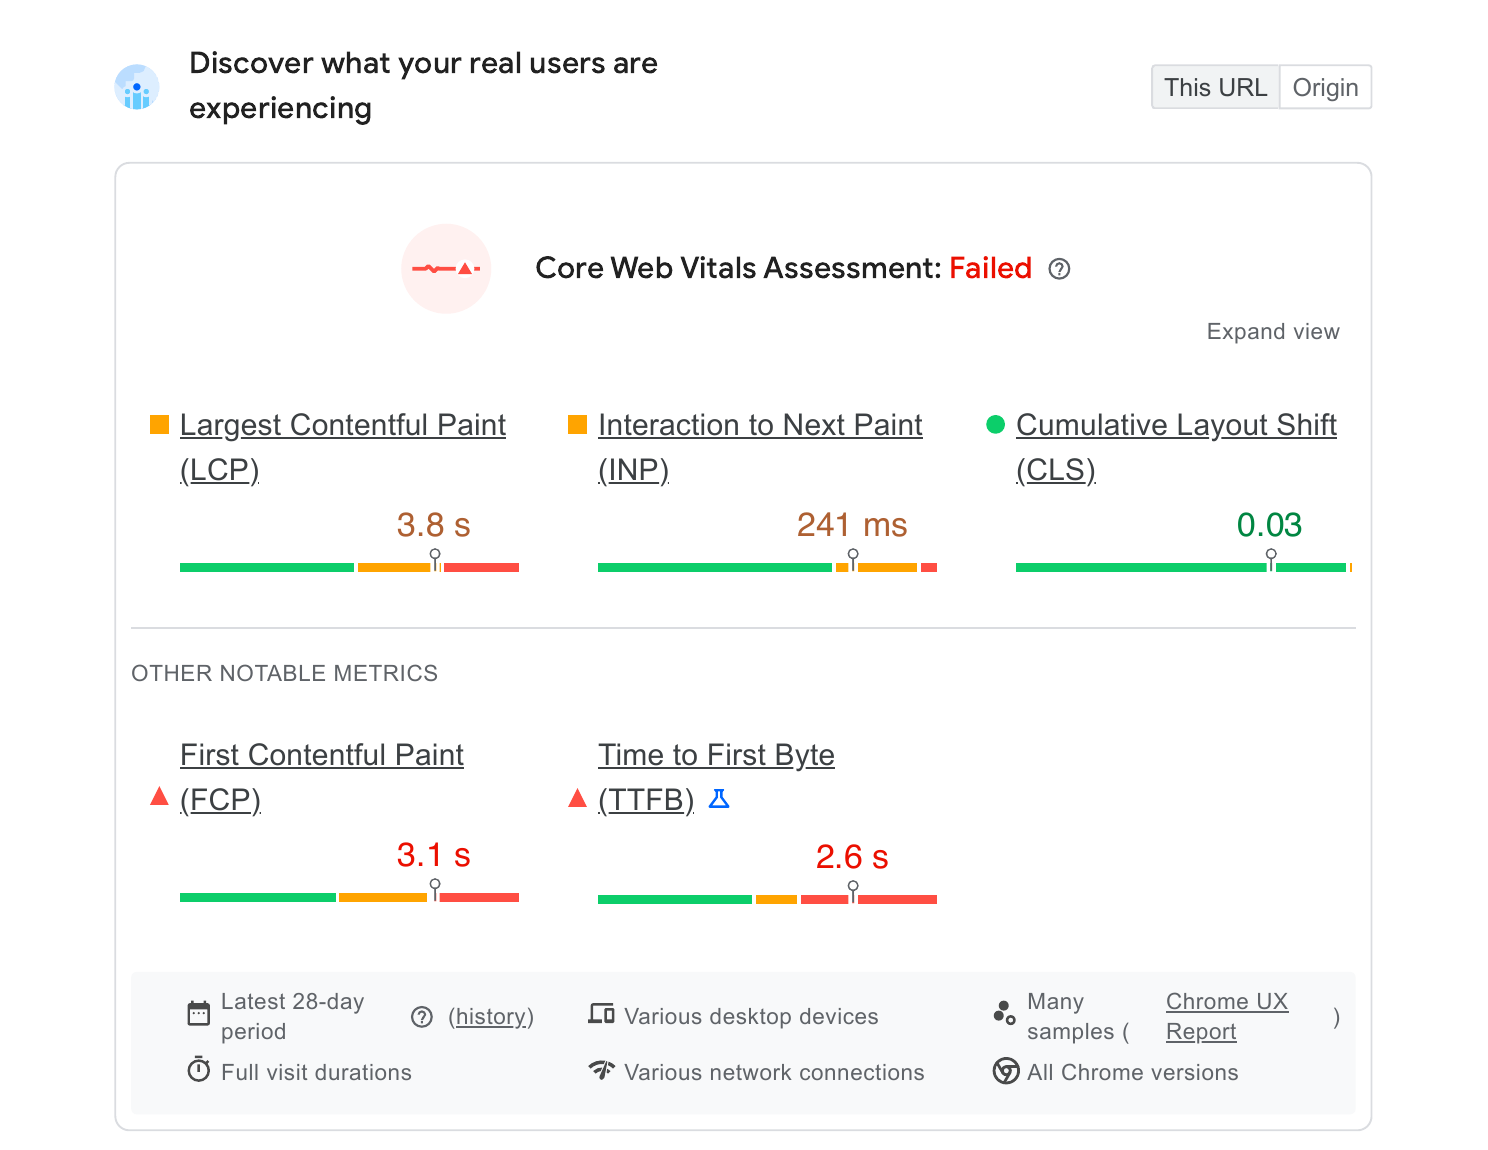
That distinction changes both the diagnosis and the size of the public claim. A later Lighthouse screenshot cannot prove that the field population passed. A green score cannot establish a ranking or conversion gain. It can record a better controlled run, provided the configuration is comparable.
Core Web Vitals matter to SEO, but they do not outrank relevance
Google says its ranking systems use Core Web Vitals and also says good scores alone do not guarantee good rankings. That is the right boundary. Performance can help distinguish pages that otherwise satisfy the query, and a poor experience can make an important page worse for its users. A fast page does not become relevant, complete or commercially useful merely because it passes.
The current Core Web Vitals thresholds are LCP at or below 2.5 seconds, INP at or below 200 milliseconds and CLS at or below 0.1, assessed at the 75th percentile. Passing means the measured population met all three thresholds at that percentile. It is not a sitewide quality score, and the result applies only to the URL or origin population and device group behind the data.
Decide whether the failing population matters before chasing the score
A failed assessment can deserve immediate engineering work, or very little. The colour does not decide.
Start with the population behind it. Is the result for the exact URL, the origin, or a Search Console group? Which device failed? Which page type carries the affected visits? A mobile failure across a revenue-bearing product template is a different problem from a URL-level failure on a page with no useful search demand.
Then connect the metric to the experience. Slow LCP on an important landing-page template can delay the page's main content. Poor INP on a product option, filter or enquiry form can obstruct the task itself. A shared cause across those pages gives one implementation more reach. If the issue appears only in a synthetic run, affects an unimportant surface, or loses to a more fundamental indexation, demand or conversion problem, it can wait.
This is the business decision no performance score contains: whether an important page set is failing for the people and devices that matter, and whether one repair can improve enough of it to warrant the work.
Use field data to choose the population, not to invent the cause
Core Web Vitals are LCP, INP and CLS measured at the 75th percentile. A good result means at least three quarters of the eligible visits met the corresponding threshold. The Chrome UX Report methodology explains the rolling 28-day collection window and the difference between URL- and origin-level data.
Those aggregates do not expose the exact request, script or element responsible. Search Console may group URLs with similar field behavior, which is useful when the same product, article or category template appears across many pages. It still does not prove that every URL in the group has one cause.
Choose representative pages from the affected set and reproduce the problem under the relevant device conditions. When the field result is origin-wide, test the major templates before assigning the homepage's trace to the whole site. When the failing experience depends on an interaction, aggregate INP is the reason to investigate; reproducing and instrumenting the actual interaction is how the cause becomes inspectable.
A lab trace is useful when it ends in a production change
The original Lighthouse run reported document request latency, render-blocking requests, image delivery, LCP request discovery, forced reflow, 3.7 seconds of JavaScript execution and nine long main-thread tasks. These leads overlap.
For example, reducing initial document latency can move every later request forward, including the stylesheet and LCP image. The savings displayed on separate audit cards can overlap. Adding them together would turn diagnostic estimates into a forecast the trace never made.
The next step is concrete: inspect when the document response arrives, when the LCP resource becomes discoverable, when it finishes downloading and what prevents the element from painting afterward. If a long task blocks an interaction, identify the handler, bundle or third-party script occupying the main thread at that time. Interpretation and a controlled change, not the audit label alone, establish whether the suspected mechanism was responsible.
When the repair belongs in a template or shared script, it becomes technical SEO work with a testable production task. “Remove this product-template bundle from the initial route because it blocks this interaction” is useful; “reduce unused JavaScript” is only the audit category.
What the overhaul changed on the same homepage
After the overhaul, GTmetrix ran the same homepage from the same location, on the same Chrome and Lighthouse versions, a day apart: performance went from 51% to 96%, LCP from 2.8 to 1.2 seconds and blocking time from 1.1 seconds to 88 milliseconds.


The Core Web Vitals case study has the rest.
Verify the release and the population separately
On release day, rerun the representative page under the same lab configuration and preserve enough detail to reproduce the comparison. Check the part of the trace the implementation was supposed to change: earlier resource discovery, a shorter long task, a removed layout shift or a faster named interaction.
The field verdict cannot arrive on release day. CrUX uses a rolling 28-day window. Before 28 complete days have passed, the window still includes pre-release visits. Once it no longer overlaps the old release, compare the same URL or group and device, while checking whether traffic volume, geography or template composition changed enough to make the populations unlike. Low-sample pages may never produce URL-level CrUX data; that is a measurement limit, not permission to relabel Lighthouse as field evidence.
Keep the controlled run and the later population result separate in SEO reporting. A green score taken after deployment may record a better release. The Core Web Vitals claim still waits for field data.